
What’s this Gauss-Markov theorem you speak of? How is it relevant to linear regression?
The Gauss-Markov theorem is a good jump-off point from which to learn about linear regression. There are many ways to fit a line through data, of which ordinary least squares (OLS) is the most well-known. (What are some examples? Generalized least squares (GLS), maximum likelihood estimation (MLE), etc.) The Gauss-Markov theorem explains that under certain conditions, OLS is the “best” method to use.
This is interesting in two ways. First, it helps us understand why everyone seems to like using OLS when doing linear regression. Second, like a big fish in a small pond, OLS is only best in a very narrow sense — it requires several strong conditions and is only best in a small class of methods. By tearing down the various conditions and probing why it can’t compete outside of its class, we end up with a good understanding of linear regression.
So what does it mean for OLS to be “best”? And what the conditions are required for this?
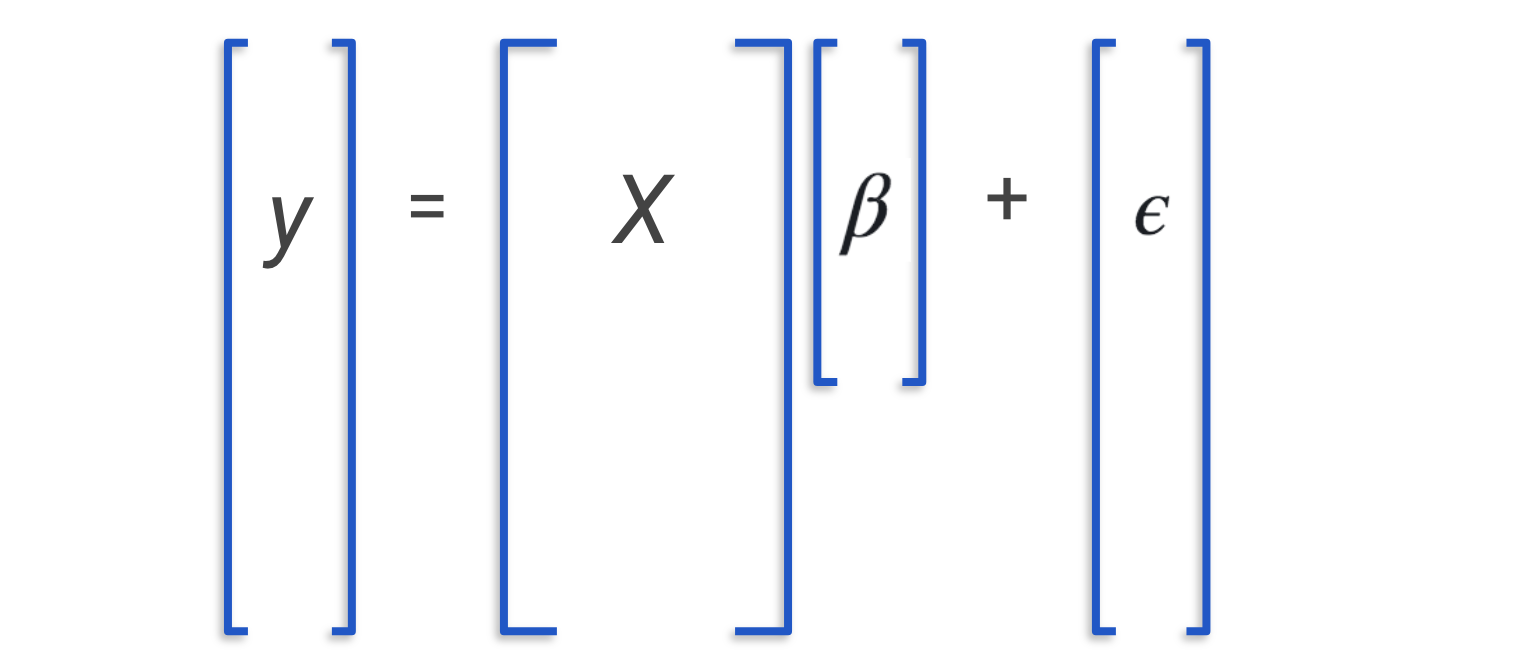
Recall, the problem of linear regression says: Suppose we have data that is generated in the secret control room of the universe** by the function . What is the best way to find ? Remember that as mere mortals, we can never peek into the secret control room of the universe. We can only observe , final result of , and which are our inputs. is top secret so we can’t just read it off our observations, and is a random variable which prevents us from deducing from what we know. We are forced to guess what it is and this process of guessing parameters of underlying models is known in statistics as “estimation”.
The Gauss-Markov theorem says: This problem is way too hard. I can’t tell you the best estimator for in all cases; but for the cases where the noise is distributed with and , then I can tell you that OLS is the best among the class of linear, unbiased estimators.
[Some people familiar with regression may ask: Don’t we also need the condition that the data is correctly modeled by ? In my view, this condition is unnecessary because it is part of the setup of the problem.]
The Secret Control Room of the Universe
One of the biggest sources of confusion in statistics seems to be the distinction between platonic ideals and observed events. Platonic ideals are pure, abstract truths like the head-tail ratio of a coin or the mean height of African elephants; and I like to imagine them as knobs sitting in a secret control room of the universe. Observed events are imperfect manifestations of platonic ideals — imperfect because we assume that randomness distorts how they manifest in the real world.
Statistics sits at bridge between the two worlds and asks: Given the events we observe, what can we say about the platonic ideals? It is paramount to know which world the objects we deal with belong to. In many cases they are clear: Population means are platonic, sample means are real-world; models are platonic, data is real-world. But for many quantities, it isn't that clear where they belong and sometimes they really do lie in between. For example, estimators, errors, predictions.
I would encourage you to be cognizant of this distinction at all times. The moment you realize you're not sure, you should probably stop and figure it out. For programmers, it is a lot like using a variable without knowing what type it is. Very dangerous indeed.
Here's a tricky one for you to think about: Confidence interval around the variance of a random variable.
Alright back to regression! The picture we want to start with is a three dimensional space with a plane in it. The plane represents the matrix.
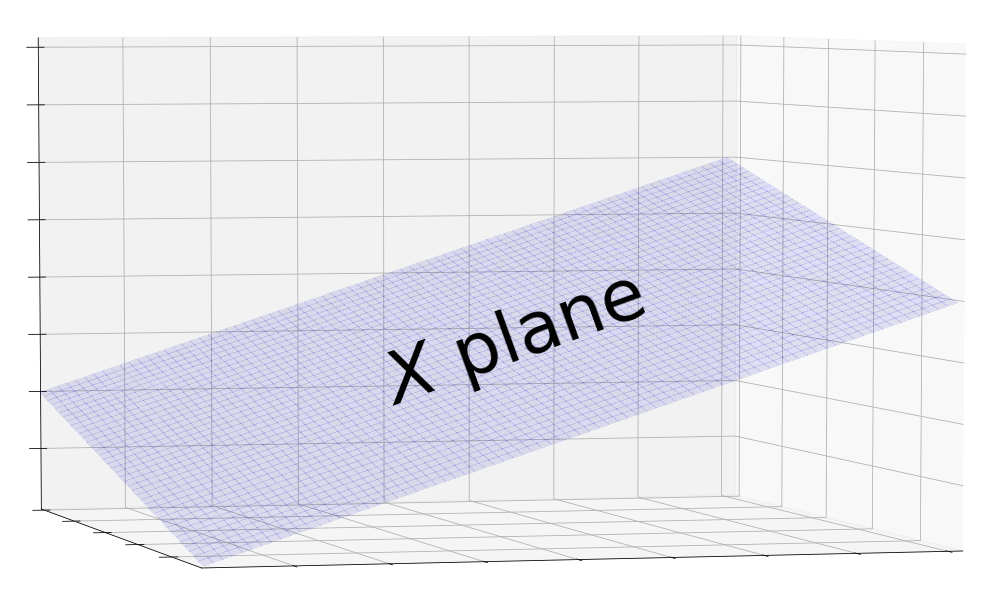
What is and why is it represented by a plane?
To answer this question, we need to build an intuition of matrices. We will develop three interpretations of a matrix, and in doing so, show the incredible power and elegance of matrix notation.
One superficial view of the matrix is as a store of data where each row stores the covariates of a single data point. is tall and skinny because it must have at least as many data points as it has covariates. This is reminiscent of what we know from high school algebra about systems of equations. Each equation provides information about the relationship between the inputs and outputs, and if we have more unknowns than we have equations, we won’t have enough information to find a unique solution for the unknowns.
We can also view as a function because it can be applied to a vector using matrix multiplication to produce another vector. More concretely, it is a function that does linear transformations: It uses the components of the vector it ingests as weights for building a linear combination of its columns. This linear combination is then output as the vector of predictions . I like to think of as a fridge where each column is an ingredient like tomatoes or carrots. It takes in recipes, s, mixes ingredients in the proportions specified, and outputs a salad.
This leads us to a third geometric view of . Since is a transformation, we can visualize it as the space of all its possible outputs. At first you might wonder: There are so many possible outputs of X. How do I visualize this? It turns out that linear algebra has good tools for this. Recall that the possible outputs are the linear combinations of X’s columns. In the language of linear algebra, we call this the space spanned by the column vectors, or the column space for short.
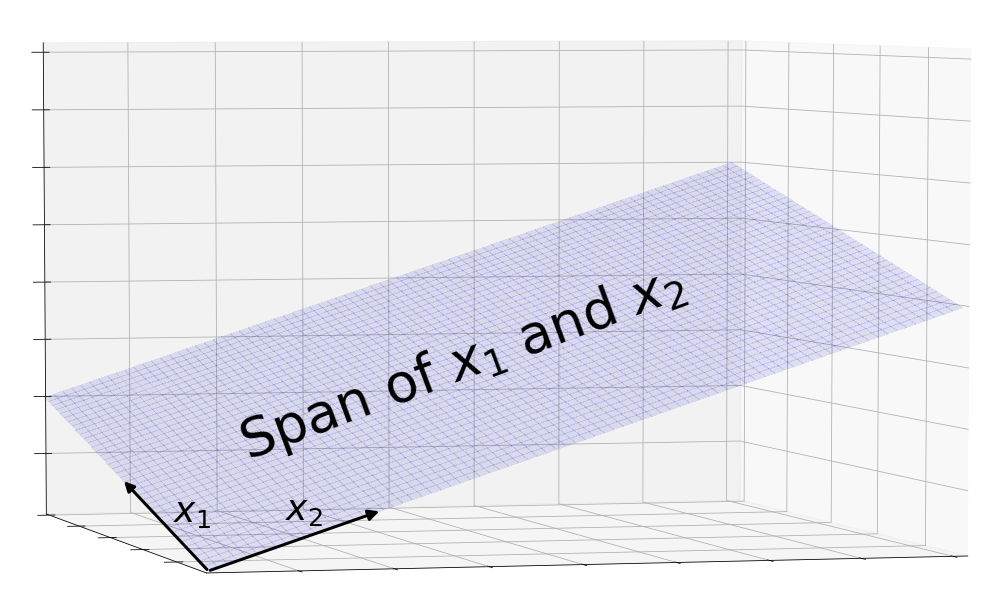
Since is tall and skinny, it has a few tall column vectors. This tells us that the column vectors live in a high-dimensional space and that there are not enough of them to span it. Therefore, the column space is a subspace of the main space. Since we’re limited to imagining the main space in 3 dimensions, the column space of is best represented by a 2 dimensional subspace, a plane.
Alright, so we have this plane. How does the problem of linear regression look like in this picture?
Recall that the plane consists of all possible outputs of including the output of the One True . This was generated in the SCRU so we can’t observe the vector it produces. What we do observe comes one step later after obscuring noise, , is added.
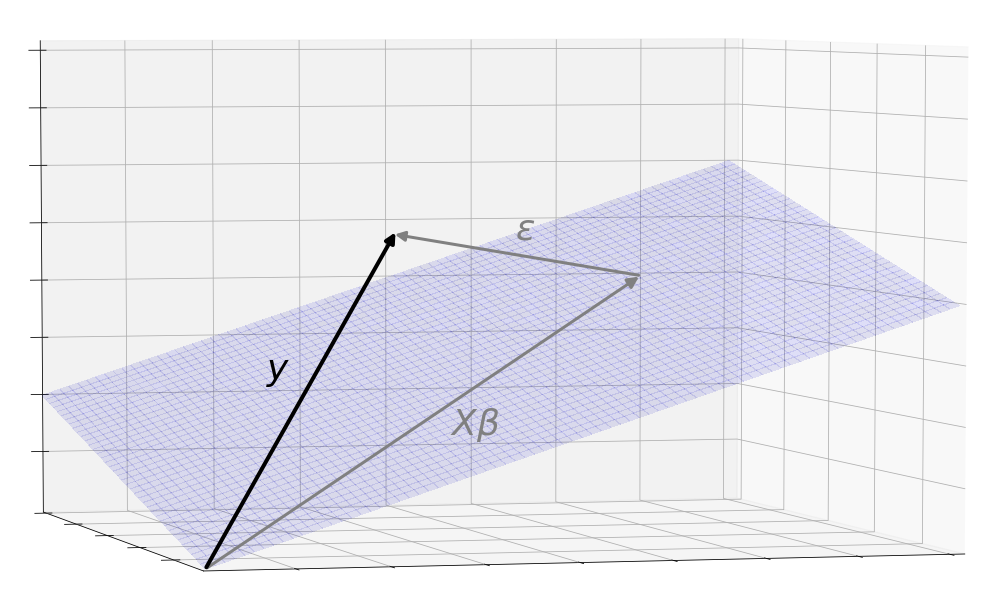
One may wonder, why is it with added, can now leap off the plane? This is because the structural component is limited to linear combinations of the columns of but is not. can take on any value in the space including areas that cannot be reached by the columns of . For example, could be (1, 0), limiting to the x axis, while in this space, could take on any value (x, y).
With this picture in mind, the problem of linear regression is to estimate a using the observed in order to produce an as close as possible to . ( is pronounced “beta hat” and is the standard notation to show that it is an estimator of a SCRU value.)
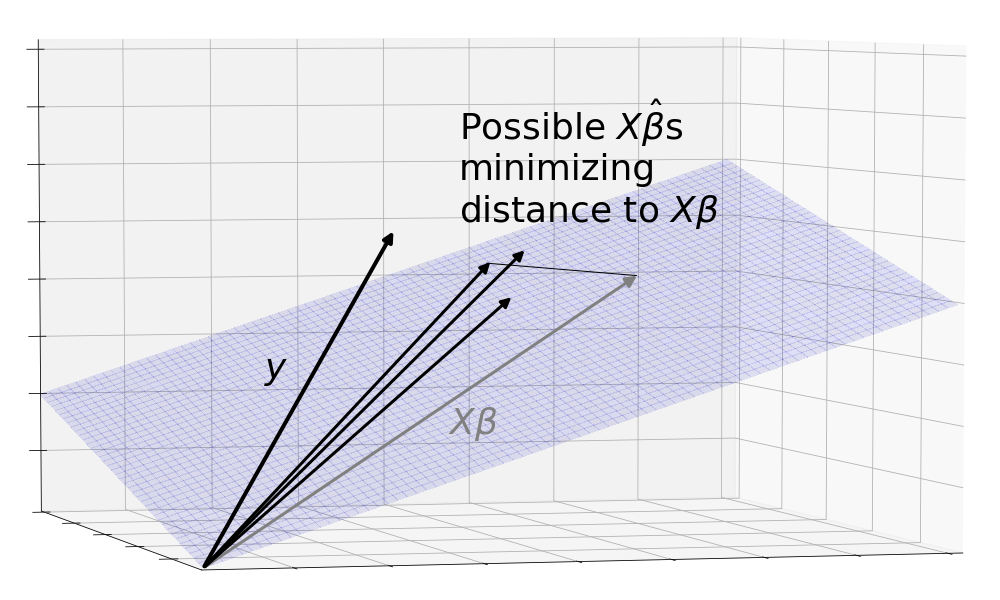
That’s not all. This picture is incomplete because it only shows one observation of . Remember that consists of the pure, consummate combined with a chaotic . Since is a random variable, each time we observe , it gives a different value. We don’t want to find a method of estimation that only works well on a lucky realization of , we want it to work well on aggregate.
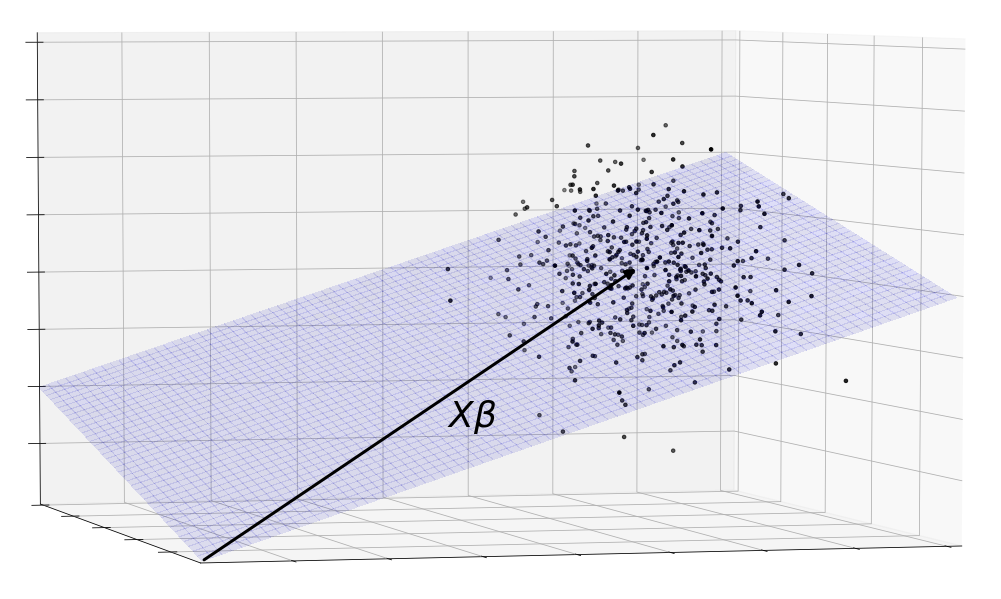
The solution is to consider the entire distribution of . Each point in this cloud is a possible observation of . Here, we’ve modeled as a three dimensional gaussian.
This is still not good enough. Clouds are not great to reason with because they are irregular and amorphous. Instead, let’s abstract the randomness away by using confidence regions. The sphere below is essentially a three dimensional confidence interval where the s are likely to be found. Also note that the region doesn’t have to be a sphere. We picked a sphere because a nice gaussian would have a spherical distribution.
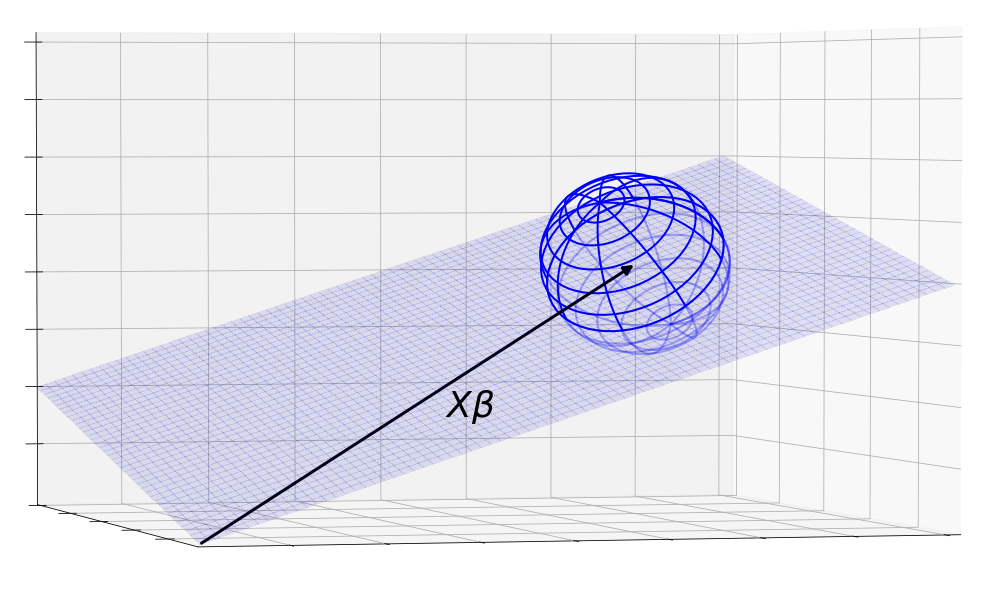
When we were working with a single observation of , the problem of linear regression was just about mapping the vector onto the plane, producing a close to . Now that we are working with a region of s, we can restate the problem as mapping the confidence region on to the plane so that the resulting area of is as tightly bunched around as possible.